
Description
This study is led by Ulrika Willén from SMHI and Ruth Mottram from DMI, with contributions from Jeppe Grej Petersen, Jose Abraham Torres Alavez and Clement Cherblanc, all from DMI.
CCI ECVs used in this Study are Total Column Water Vapour (TCWV), Ice sheet surface Velocity (IV) and Surface Elevation Changes (SEC) and Gravitational Mass Budget (GMB). In future work for this study Land Surface Temperature (LST) will be used.
We use regional climate model (RCM) data of high resolution (~10km) from the Horizon2020 PolarRES project for the Arctic and the Antarctic where the models have been run in hindcast mode using ERA-5 reanalysis data from 2001 to 2020 as boundary conditions. This ensures that the RCM simulations generate weather conditions that are as close as possible to those observed during this 20-year period. This allows us to use satellite data to check how accurately the climate models represent the processes generating key weather phenomena of the Polar Regions such as snowfall and surface snow and ice melt. Snowfall is difficult to measure on the ground accurately, and there are very few observations, but as it drives the formation of ice sheets and glaciers it is crucial for it to be well simulated. Similarly, surface melt and runoff also shape the driving dynamics of glaciers and ice sheets. Together the budget of snowfall and snow melt and runoff give us the surface mass balance or budget of the ice sheets. Being able to simulate these properties are crucial for future climate and sea level rise projections. Five RCMs run in PolarRES over both the Arctic and the Antarctic are used in this study.
The scientific questions this Study aims to address include:
- Can regional/global climate models accurately represent the atmospheric and surface processes like snowfall and snow-melt affecting the ice-sheets?
- Do the models capture the variability of the ECVs and the albedo and emissivity feedbacks over the ice sheets?
- Where, when and why do the surface mass balance of the model's processes perform least and most well?
- Which ECVs show the most important biases affecting the surface mass budget estimates from regional/global climate models?
- Can the metrics be used for observational based model selection to reduce the spread of the ice sheet contributions to the future sea level rise?
Mottram et al. (2019) used a total ice mass change time series for the entire Greenland Ice Sheet, using the Gravity Recovery and Climate Experiment (GRACE) satellite, generated by the Danish technical University and Technical University of Dresden. This satellite product (Greenland Ice Sheet CCI GMB) was compared with simulations from two regional climate models (HIRHAM5 and RACMO2.3) for different drainage basins and the entire Greenland Ice Sheet. A similar study was undertaken for Antarctica (Mottram et al., 2022).
This Study extends those intercomparisons to a new ensemble of sophisticated regional climate models. We also include two new CCI datasets alongside the GMB data previously used. The observed Surface Elevation Changes (SEC) are due to both snowfall and surface melt and runoff, as well as ice dynamic processes related to ice flow. We therefore compare SEC with precipitation across the ice sheet as a whole and on a basin scale. To account for dynamically driven ice processes that alter surface elevation we use the ice velocity (IV) datasets across the ice sheet to calculate the theoretical change in ice thickness. The use of these satellite datasets thus gives us a completely independent source of evaluation data for the RCMs.
Initial activities and findings (September 2025)
Final results and conclusions will be provided once the Study is complete in March 2026.
For the satellite observations of water vapour (WV) and surface temperature data we have so far checked the data for missing or odd values and artificial trends over ice-sheet regions by comparing to ERA5 reanalysis data. We found some unrealistically large values for CCI total column water vapour over Greenland for some months, especially for autumn and winter. This is due to corrupt data with no latitude/longitude information in the Modis-Terra v3.2 dataset. The CCI_WV team are aware and this has been filtered in the next ESA-CCI version that will be available soon.
We use the ice sheet ECVs to assess how well the RCMs resolve ice sheet surface mass balance (SMB), the balance between snowfall and mass loss from melt, runoff, evaporation and sublimation. As observations of SMB are usually point measurements they are difficult to relate to the typical RCM grid scale of kms to 10s of kms. Earth observation data are therefore useful for assessing the performance of models in reproducing SMB over wide areas. Our results are shown below for the two polar ice sheets.
We have added Glacier ECV GMB together with a satellite derived glacier discharge to assess if the RCMs are capable of reproducing the observed change in total mass budget, as measured by the GRACE and GRACE-FO satellites over both ice sheets. In this we are to some extent hindered by the RCMs resolution, which in the case of the PolarRES RCMs is around 12km. This is sufficient for some of the largest Arctic ice caps but does not resolve smaller glaciers and work is ongoing to explore solutions like statistical downscaling of the model outputs.
Antarctica
Our initial results show that the modelled mass budget (in this case precipitation (P) minus evaporation and sublimation (E)) compares well with the SEC ECV but the contribution of ice sheet dynamics, DYN, to the SEC needs to be taken into account. There are some significant biases in the coastal zones, particularly in West Antarctica that probably relate to some of the assumptions we make of steady state internal deformation driving most of the ice velocity.
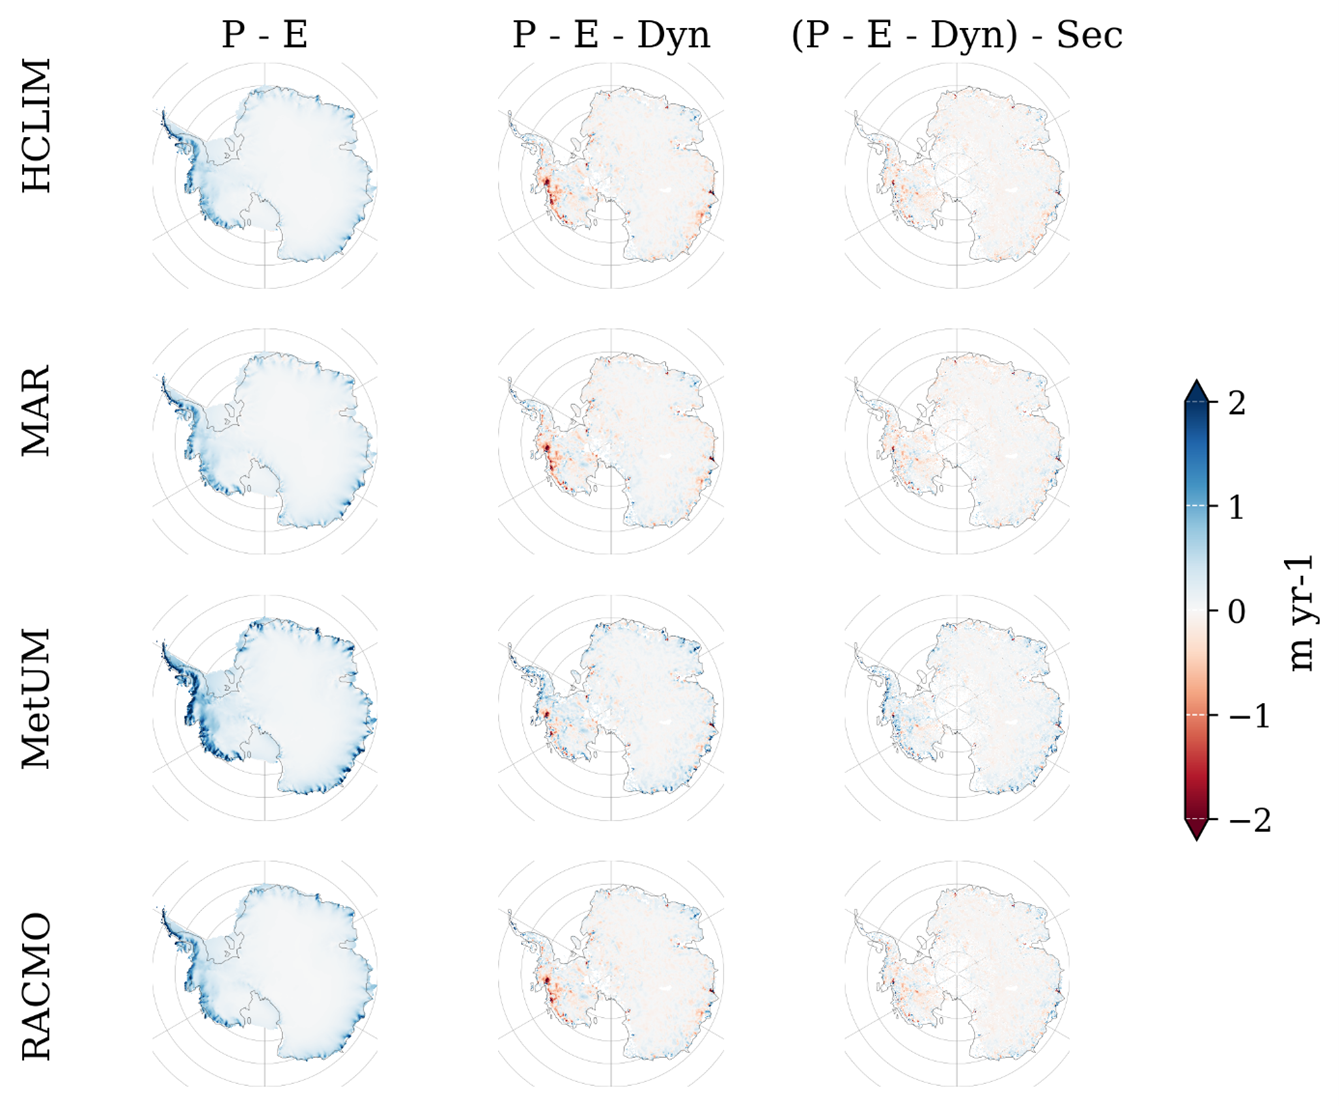
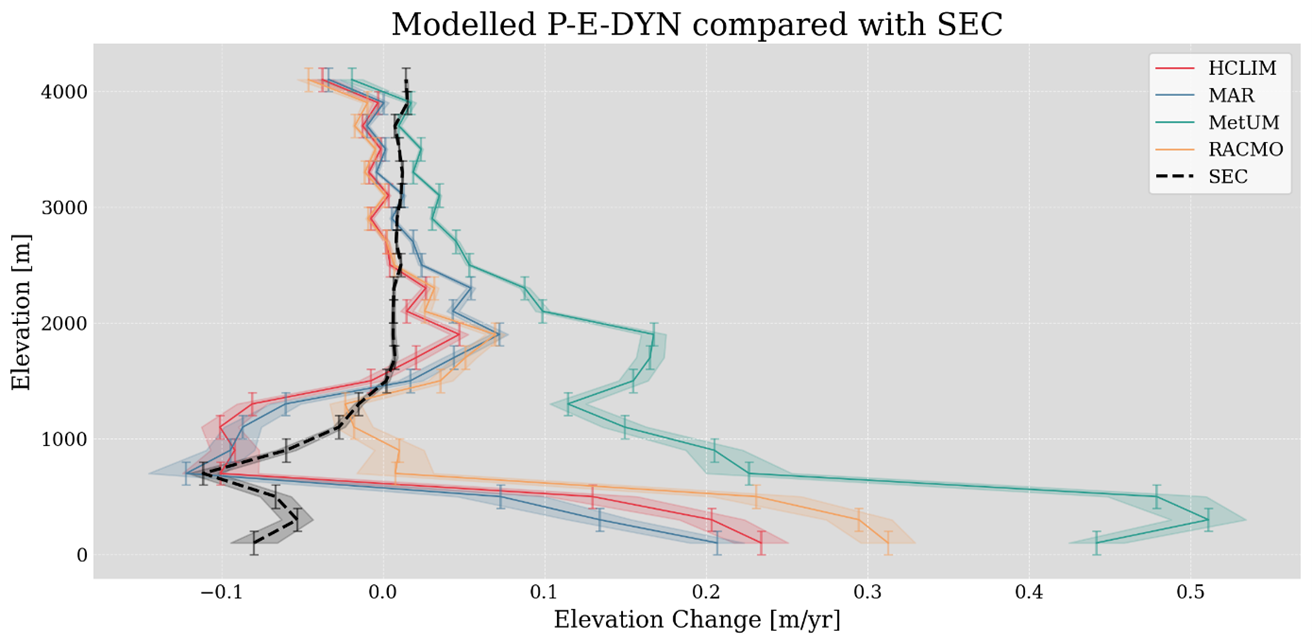
The bias in P-E is likely related to the orographic effects on precipitation distribution. This is illustrated in Figure 2 where the modelled P-E-DYN (the central column in Figure 1) is plotted for 200 m elevation bands summed across Antarctica. The observed SEC is shown in black and the models in the different colours, with elevation bins denoted by the vertical bars. Fig. 2 shows that the models are more consistent at the upper elevations, covering the vast Antarctic plateau, but there is wider spread at lower elevations below 2000m, corresponding to the steeper continental slopes where precipitation maxima are typically located. The models different parameterisations and precipitation schemes likely contribute to some of the spread in this figure. In particular an underestimate and then an overestimate in SEC between 1000 and 2000m elevation in some models suggest that their precipitation schemes are lifting precipitation higher up the slopes. It is however also important to note that effects such as katabatic and barrier winds may not be resolved in these simulations. These processes would typically redistribute snowfall on slopes in these elevation bands. Our analysis therefore shows how useful the combination of earth observation data with insights from climate models can be in giving insight into processes.
Greenland
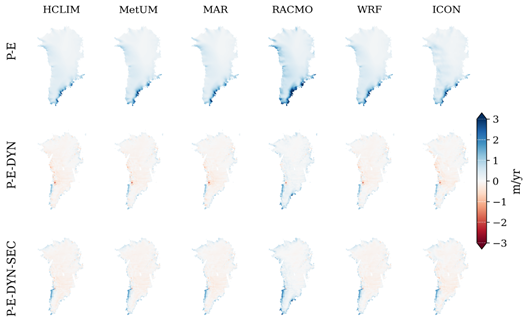
We have carried out a similar analysis over Greenland in an ensemble of 6 RCMs (Figure 3). Many of these models do not have a full SMB scheme so the lower ablation area (roughly the area below ~1800m elevation) is not represented well. However, over the interior we see a relatively small bias between SEC and modelled SEC of the order of a few tens of centimetres and gradually increasing at lower elevations. The bias is larger than in Antarctica and while ongoing work is examining why, it is likely that melt percolation and refreezing even at high altitudes in Greenland complicates the interpretation of the intercomparison.
Outlook
Preparation of these early results for a publication is in progress and analysis of potential biases is underway. In particular we plan to add further data on precipitation from in-situ observations.The integrated water vapor and land surface temperature have recently been extracted from a number of PolarRES simulations to be used in this study. The next step at SMHI will be to evaluate the regional climate models for present day, using ESA-CCI and other observational data and investigate if they capture extremes, the variability and the albedo and emissivity feedbacks. We also plan to analyze the variability and extremes for all six land surface temperature LST_cci products when evaluating the regional models and calculating metrics and compare trends when possible. We will add the Glacier ECV for GMB (gravitational mass budget) to the analysis.DMI has validated the PolarRES regional climate models against T2m station measurements over Greenland and will add the CCI LST dataset to those comparisons to fill the station gaps which will also help to indicate where melt and runoff is a likely source of bias. Future contributions in the course of the ESA funded PISCO project will also extend the analysis to the surface energy balance over the ice sheets as a potential source of bias. We will also explore solutions like statistical downscaling of the model outputs to resolve small glaciers.The CCI ECVs uncertainty information will also be used in the evaluation processes when assessing the ECV relationships and calculating metrics.
References
Good, E. J., Aldred, F. M., Ghent, D. J., Veal, K. L., & Jimenez, C. (2022). An analysis of the stability and trends in the LST_cci Land Surface Temperature datasets over Europe. Earth and Space Science, 9, e2022EA002317.Kittel et al 2021: Clouds drive differences in future surface melt over the Antarctic ice shelves. https://tc.copernicus.org/articles/16/2655/2022/Mottram et al 2019: An Integrated View of Greenland Ice Sheet Mass changes based on Models and Satellite Observations. https://www.mdpi.com/2072-4292/11/12/1407Mottram, R., Hansen, N., Kittel, C., van Wessem, J. M., Agosta, C., Amory, C., Boberg, F., van de Berg, W. J., Fettweis, X., Gossart, A., van Lipzig, N. P. M., van Meijgaard, E., Orr, A., Phillips, T., Webster, S., Simonsen, S. B., and Souverijns, N.: What is the surface mass balance of Antarctica? An intercomparison of regional climate model estimates, The Cryosphere, 15, 3751–3784, https://doi.org/10.5194/tc-15-3751-2021, 2021.Stooksbury, D. E., Idso, C. D., & Hubbard, K. G. (1999). The effects of data gaps on the calculated monthly mean maximum and minimum temperatures in the continental United States: A spatial and temporal study. Climate, 12(5), 1524–1533.Wille et al 2022: Intense atmospheric rivers can weaken ice shelf stability at the Antarctica Peninsula. https://www.nature.com/articles/s43247-022-00422-9