
As the world is turning its attention to Bélém for COP 30, hosted in the heart of the Amazon rainforest, ESA’s Climate Change Initiative (ESA-CCI) team launched a competition to harness the power of satellite-derived data to visualise forests’ role and vulnerability in climate change.
The mission: transform cutting-edge Earth observation data into powerful visuals revealing the two-way link between climate change and forest loss—from shifting forest biomass and CO₂ emissions from deforestation to forests’ vulnerability to extreme weather events. Can you turn this science into a visual wake-up call?
The overall winner will be announced soon and the winner will be invited to a behind the scenes tour of ESA’s state of the art Earth Observation Multimedia Centre in Italy.
How?
Participants were invited to bring the ESA-CCI ECVs (Essential Climate Variables) data to life with stunning visualisations and demonstrate your creativity in one of three competition categories:
- Static image: An infographic with a clear and impactful message
- Animation: A timelapse or GIF illustrating changes over time
- Interactive: A scrollable story or dashboard allowing user engagement
The Challenge
Forests are essential for Earth’s climate, as they serve as a major sink of CO₂, and thus influence local and regional climate through carbon storage. They affect Earth’s surface energy balance and the water cycle. They are also an essential shelter to 80% of all terrestrial species. But with rising global temperature, ecosystem services provided by forests, such as climate regulation, carbon sequestration, and habitat provision are under threat. While the burning of fossil fuel is estimated to account for around 90% of the additional carbon dioxide in the atmosphere at present, deforestation accounts for most of the rest, showing how human activities amplify forests’ roles in climate change.
Here are some of the many angles we invited participants to explore with your climate data visualisation:
- Biomass changes over time: Show how forest carbon stocks have changed over the past decade in critical hotspots such as the Amazon, Southeast Asia or Congo.
- Impacts of deforestation on emissions: Visualise CO₂ emissions resulting from forest loss in tropical regions, and their connection to land-use change.
- Visualise how extreme weather events, which are increasing and becoming more frequent under climate change, are affecting forests.
- Investigate connection of biomass change to changes in other parameters, such as changes in clouds and explore the implications for climate feedback loops.
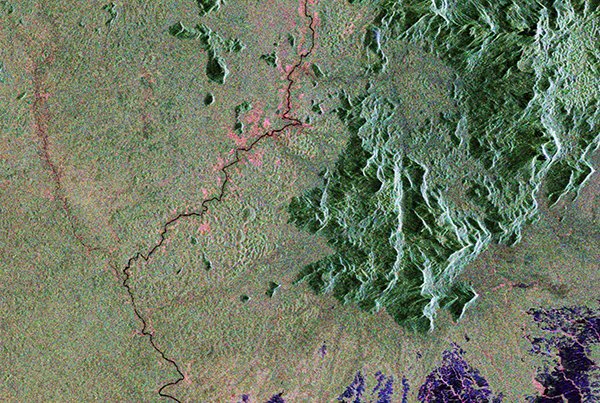
 Biomass in the Amazon North of Bolivia, 2010-2020. Credit: Santoro, M.; Cartus, O. (2025): ESA Biomass Climate Change Initiative (Biomass_cci): Global datasets of forest above-ground biomass for the years 2007-2022, v6.0. NERC EDS Centre for Environmental Data Analysis, 17 April 2025.
As part of the competition’s planning phase, we organised a training session introducing the Training Environment and CCI Toolbox. The session included a tutorial on how to access and visualise CCI data using example notebooks. Participants also received guidance on effective climate science communication, as well as instructions on registering for the dedicated JupyterLab environment to develop their visualisations and code. You can access the training session here: Visualising Forests in a Changing Climate: An ESA CCI Data Challenge