
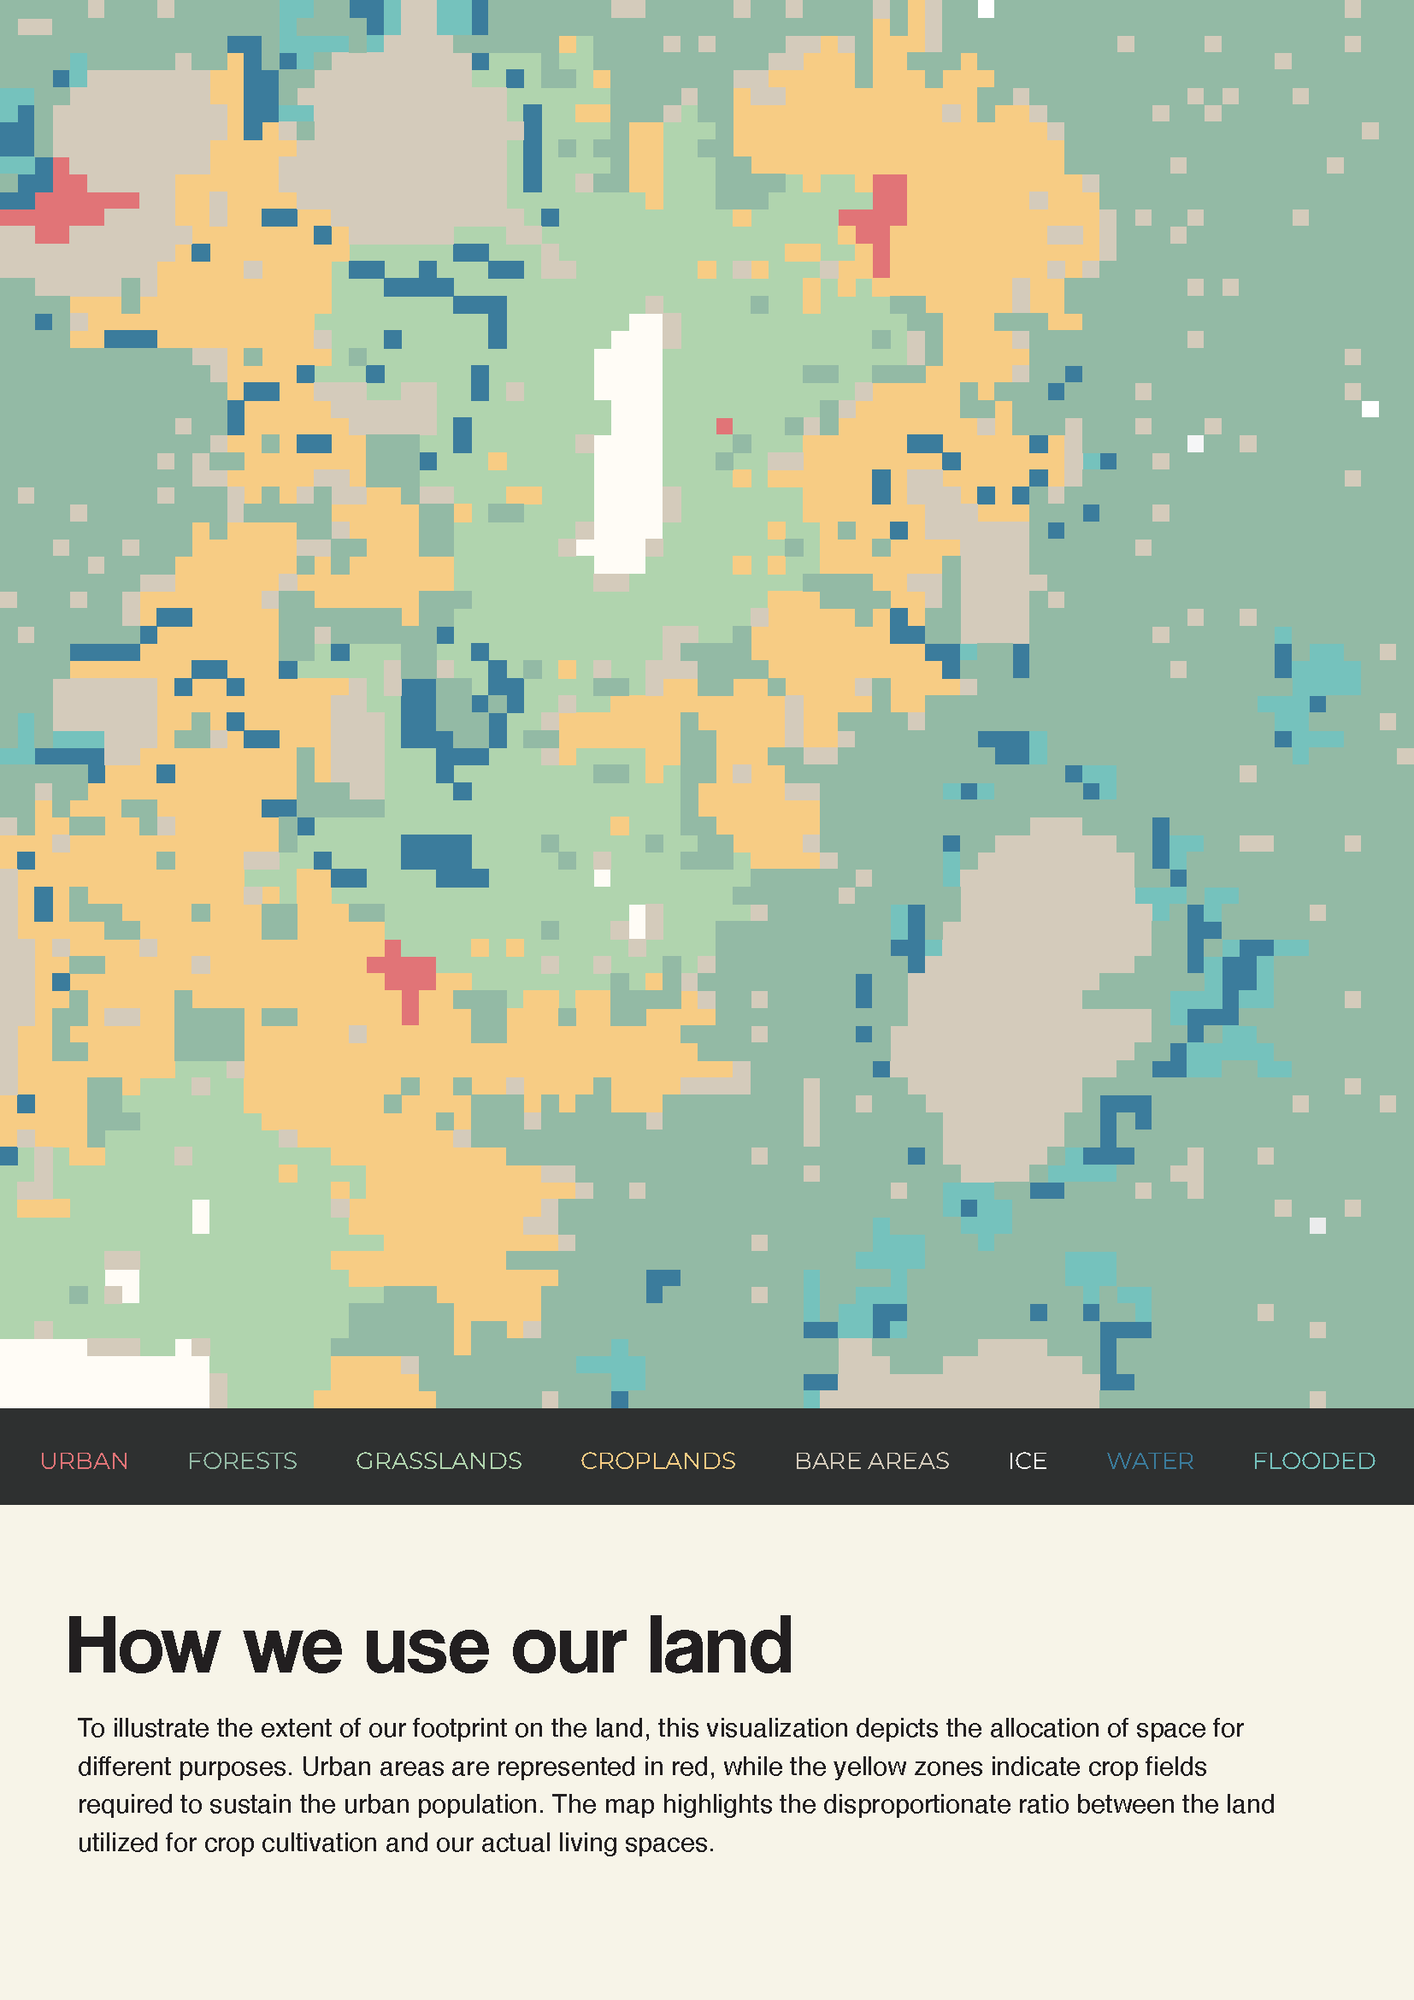
This Little Picture depicts the proportions of Land Cover classes across the planet. It also illustrates the extent of the human footprint on the land. Urban areas are represented in red, while the yellow zones indicate crop fields required to sustain the urban population. The map highlights the disproportionate ratio between the land utilised for crop cultivation and our actual living spaces.
In Jan's own words: 'I've used Wave Function Collapse - a progrmme that generates bitmaps to generate a new "map" of worldwide land cover composition. When combining data from all available countries, the respective proportions taken up by the land types is the same as the worldwide distribution.'
About
The Little Picture depicts the proportions of Land Cover classes across the planet and the extent of the human footprint on the land. The creator, Jan Everaert aimed to highlights the difference between land utilised for crop cultivation and our actual living spaces.
Land cover and land cover changes influences climate by modifying water and energy exchanges with the atmosphere and by changing greenhouse gas and aerosol sources and sinks. Land Cover is considered as one of 54 Essential Climate Variables by the Global Climate Observing System.
Judges commendation
- 'Excellent use of colour and spatial information to communicate how we use our land area which is not often discussed.'
- 'I like the slightly 'civilisation' esque approach to the design!'
Data
The Little Picture uses data drawn from the Land Cover data from the ESA Climate Change Initiative (Defourny, P. (2019): ESA Land Cover Climate Change Initiative (Land_Cover_cci): Global Land Cover Maps, Version 2.0.7. Centre for Environmental Data Analysis, date of citation. https://catalogue.ceda.ac.uk/uuid/b382ebe6679d44b8b0e68ea4ef4b701c).
Specifically, Jan used processed CSV data available from the following link to support this competition https://github.com/littlepictures/datasets/tree/main/lc-1.
Script
There were no scripts used to build this Little Picture Jan developed scripts available at https://github.com/EveraertJan/LittlepicturesWFC
Jan used processing to accumulate all available CSV files from https://github.com/littlepictures/datasets/tree/main/lc-1 into one large file and grouped the fields based on their respective land classification. The initial step placed water, ice and urban areas based on a noise field, after which WFC (wave function collapse) is used to generate the adjacent tiles, making sure only the "expected" tiles are placed next to each other. Every time a field is generated, it is noted to prevent more fields of a type to be generated, based on the data (if the system calculates at the start that only 50 urban fields are allowed based on the proportions of the sketch and tiles, it wil stop generating them once 50 have been placed).
Licence
This Little Picture is published under CC BY-SA 4.0 licence.
The big picture
The European Space Agency (ESA), the European Centre for Medium-Range Weather Forecasts (ECMWF), and the European Organisation for the Exploitation of Meteorological Satellites (EUMETSAT) work closely together to measure, process & make space-derived information about the climate available.
ESA
The mission of the Climate Change Initiative (CCI) is to realise the full potential of the long-term global Earth Observation archives that the European Space Agency (ESA), together with its Member states, has established over the past 40 years, as a significant and timely contribution to the climate databases required by the United Nations Framework Convention on Climate Change. The ESA Climate Office provides a free & open CCI data facility bringing together ECV data from across its twenty-seven climate science projects, including a CCI Data Standards and a CCI Toolbox.
ECMWF
The Copernicus Climate Change Service (C3S) supports society by providing freely available authoritative information about the past, present and future climate in Europe and the rest of the World. C3S is one of the six thematic information services provided by the Copernicus Earth Observation Programme of the European Union, and has been entrusted by the European Commission to the European Centre for Medium-Range Weather Forecasts (ECMWF). One of the core components of C3S includes the Climate Data Store (CDS). This is a one-stop shop for climate information. It provides free and easy access to a wide range of climate datasets via a searchable catalogue. A freely available online toolbox allows users to build workflows and applications suited to their needs.
EUMETSAT
EUMETSAT operates missions both to provide weather and climate data for its member states, and as an entrusted entity under the Copernicus programme. Several missions are operated collaboratively with ESA, providing complimentary expertise and data processing, to process and distribute land, marine, and atmosphere relevant products for users. Data from EUMETSAT operated missions is frequently available in near-real-time, facilitating rapid monitoring and forecasting. Via EUMETCast, the EUMETSAT Data Services, or WEkEO, users can access data in ways that suit their needs. The data is used by the EUMETSAT satellite applications facilities, as well as across the various Copernicus Services.
next