ESA’s Climate Change Initiative provides a major and growing contribution to the physical evidence used by the IPCC to assessment the state of the global climate.
In its latest and Sixth Assessment report, the IPCC identifies Earth observing satellites as a critical tool to monitor the causes and effects of climate change and directly acknowledges the contribution of Climate Change Initiative.
These Assessment reports provide a key input to international policy making decisions focussed on the global response to climate change and keeping the Paris Agreement goals on track.
An explicit objective of the CCI to support the International Panel on Climate Change by providing robust observation evidence records for key aspects of the climate. Using observations from multiple satellites, the programme performs the necessary R&D to generate robust, long-term climate datasets and the CCI contribution to the report was significant.
Fifteen scientists working as part of the ESA’s CCI programme helped to author the report, with five taking lead and coordinating author roles including Richard Jones, of the UK Met Office and science leader for the CCI Climate Modelling and User Group project. Impressively, the report cited over 130 CCI-generated research papers and datasets more than 400 times throughout the report on climate variables spanning the cryosphere, oceans and terrestrial domains.
The majority of CCI papers cited – c100, were from the Working Group 1 report which focussed on the physical basis of the climate. Thirty papers however were cited in the impacts and adaptation focussed Working Group II report, reflecting the growing use of Earth observation data to address as well as monitor the climate.
Since the IPCC’s previous report was released in 2013 the CCI contribution has more than tripled, which also reflects the recognised value and availability of an expanding suite of satellite-derived data records available from the programme, which now covers 27 ECVs.
The IPCC report’s headline statements were supported by CCI satellite data records in a. number of areas with a few examples highlighted below:
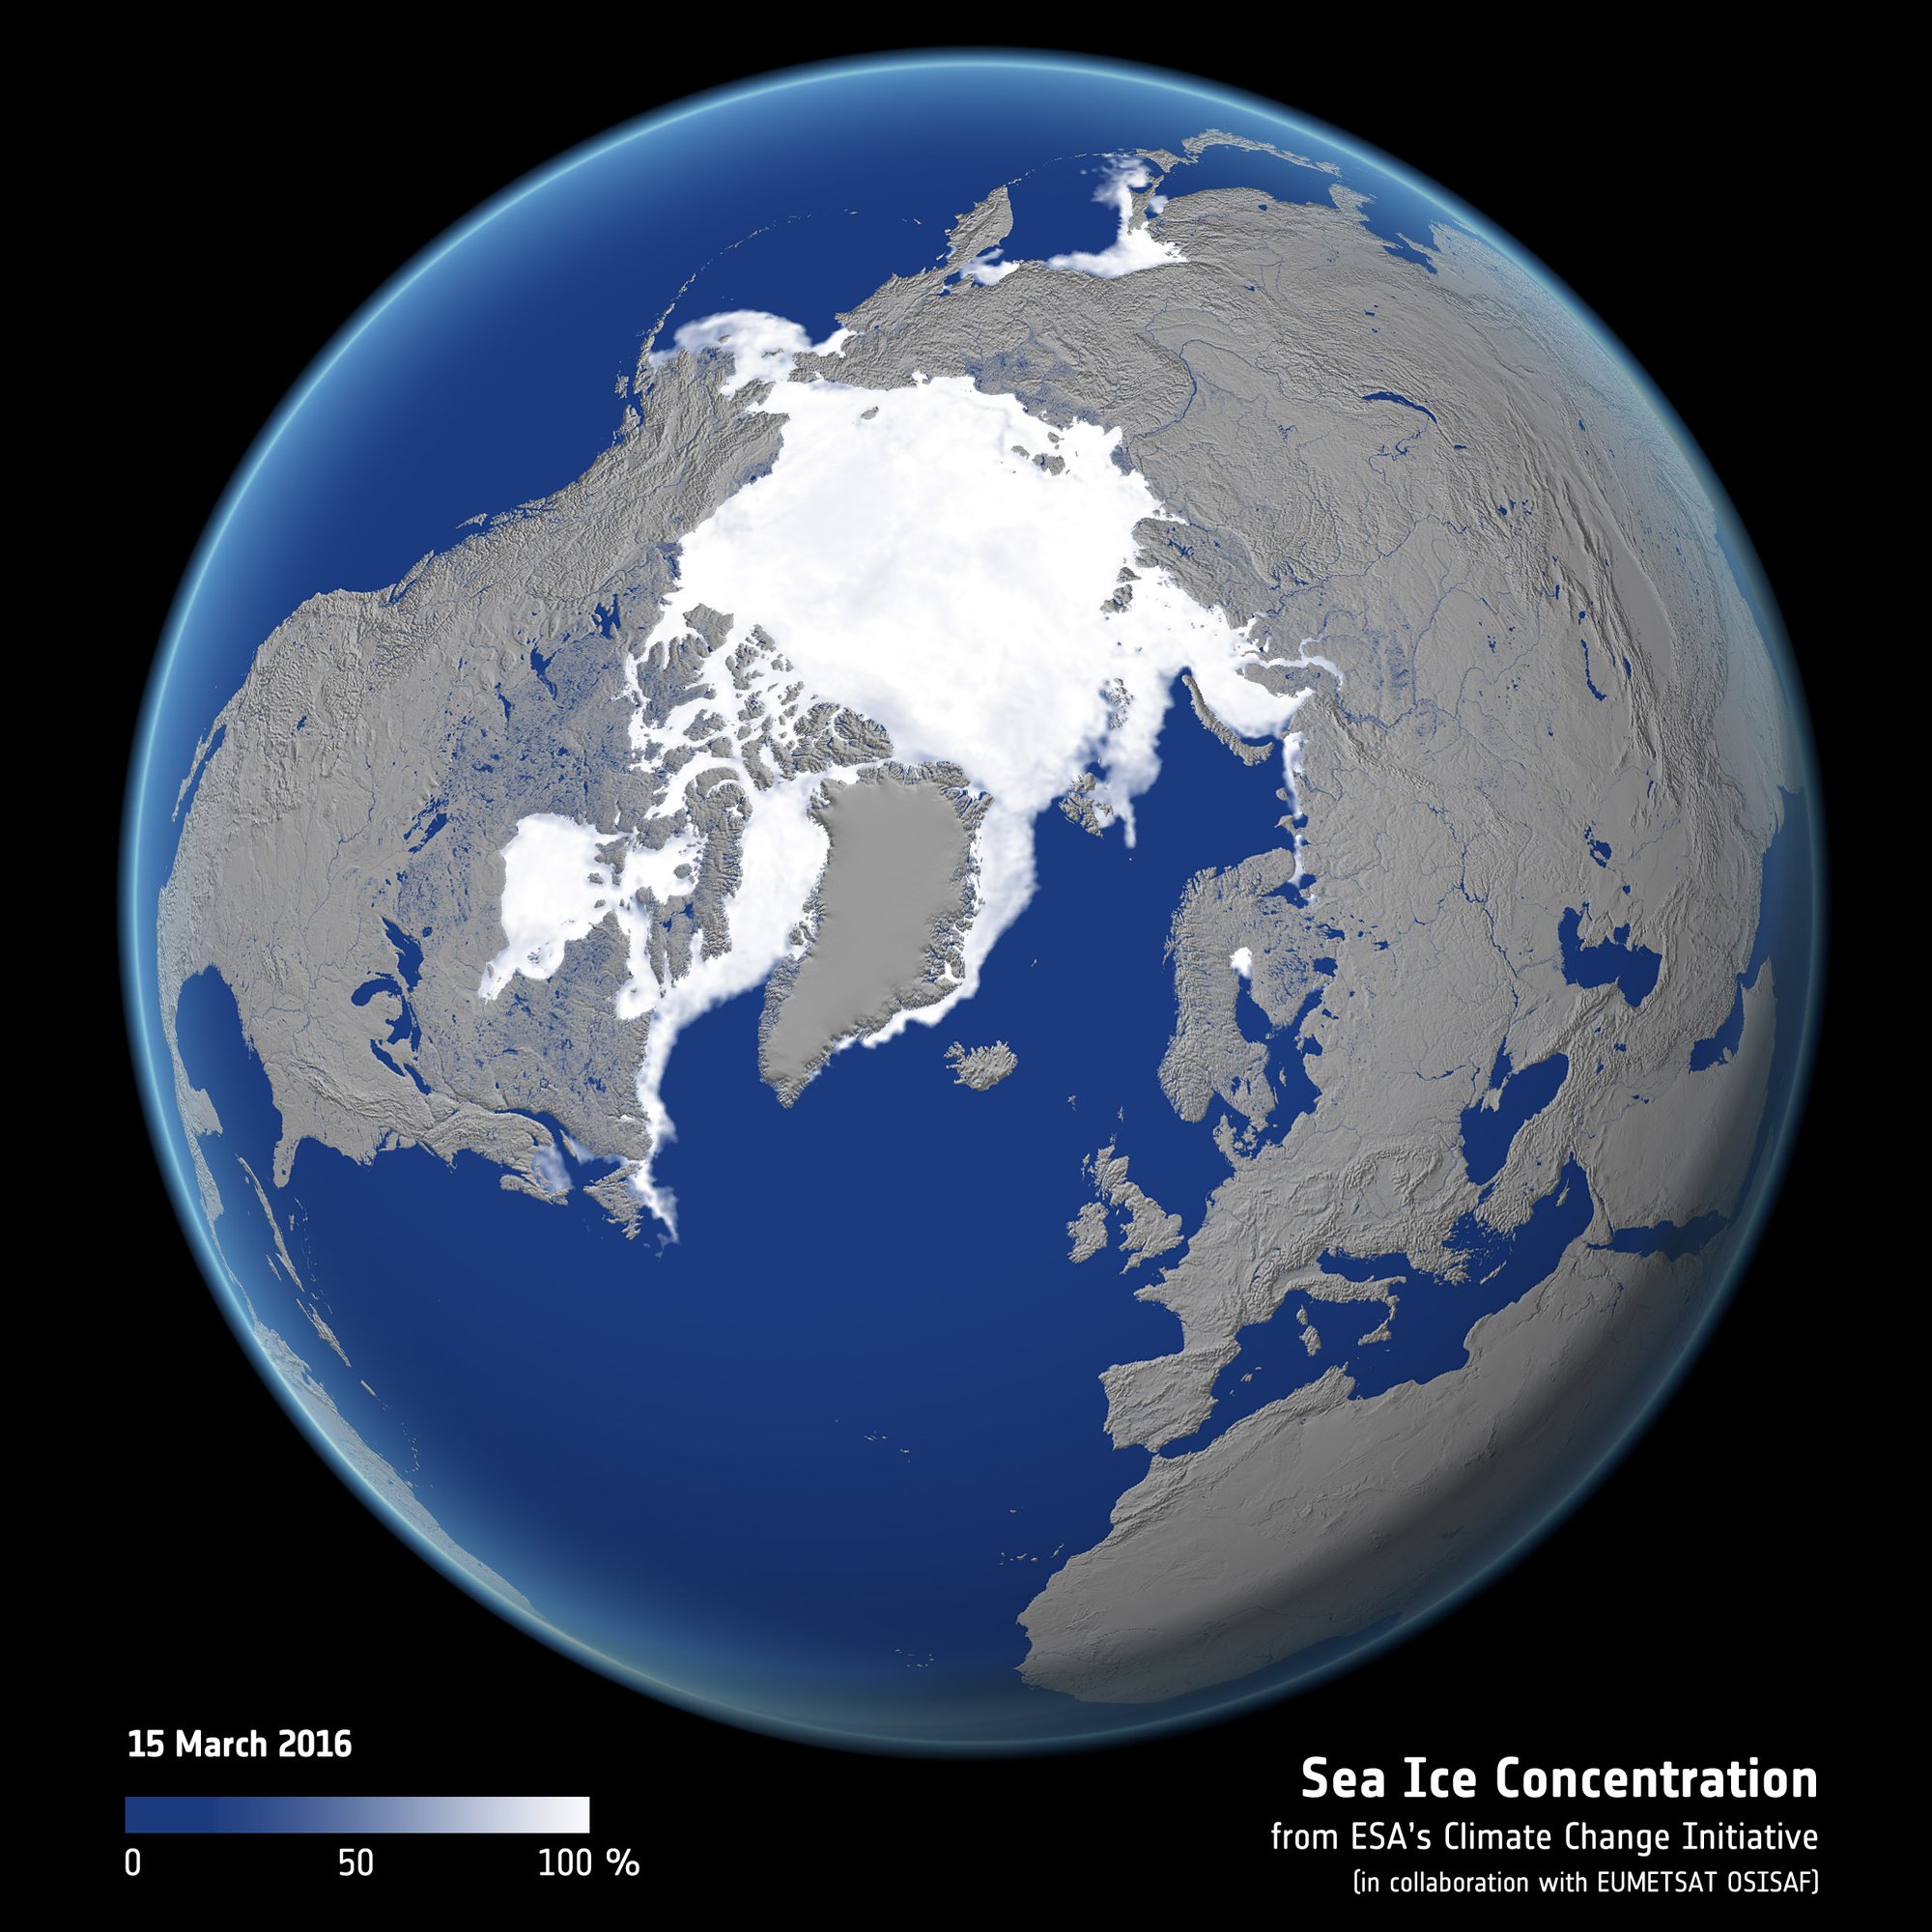
Sea ice past, present and future
Remote sensing has revolutionised our knowledge of the world’s frozen areas, particularly near the poles where conditions make surface observations difficult.
Using Earth observation data the report details that September Arctic sea ice extent for example continues its long-term decline – a trend tracked from space since 1979.
Model simulations, validated using CCI satellite-based observational datasets predict that the Arctic sea will be practically ‘ice free’ in summer at least once by 2050.
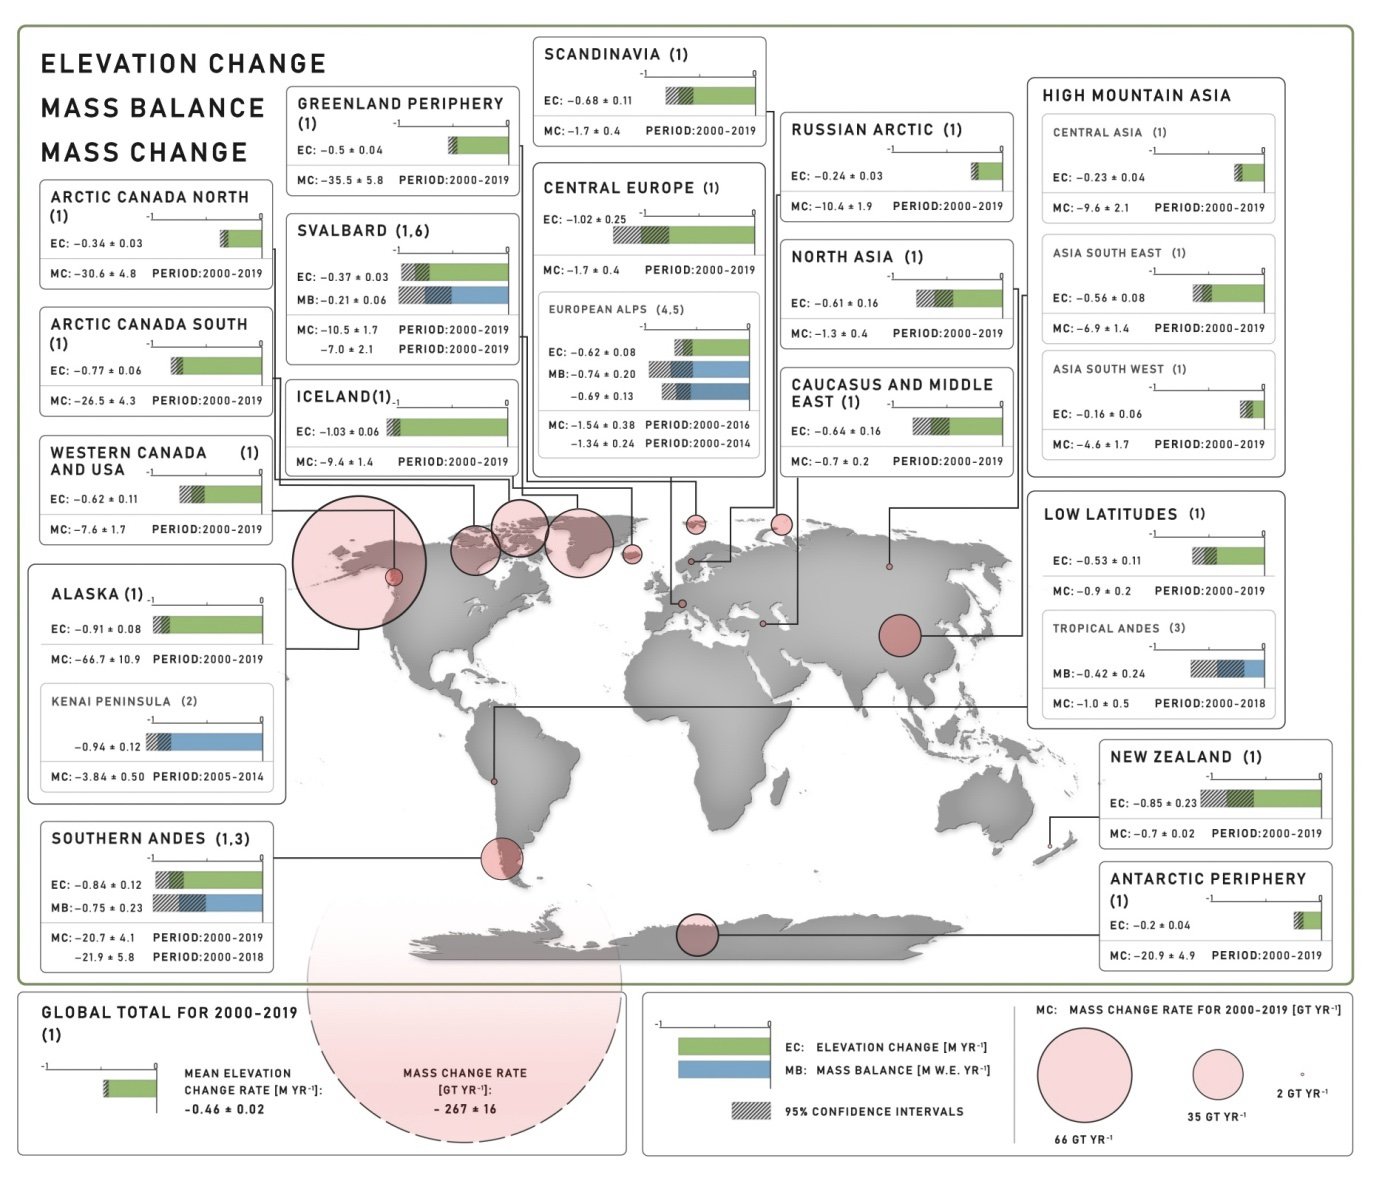
Glacier decline
Satellite records, and research supported by CCI, which contribute to global glacier inventories provide crucial lines of evidence that support the report’s claim that most of the world’s glaciers are in retreat and that glacial ice loss has accelerated since the 1990s and is ‘very likely’ driven by human influence.
These data track glacier mass balance and elevation changes across thousands of remote glaciers worldwide and assess their contribution to sea level rise.
Ice sheet melt
Using satellite surveys such as ESA’s CryoSat and the European Union’s Copernicus Sentinel-1help to measure changes in ice volume and flow, as well as satellites that provide information on gravity, to establish how much ice is being lost.
The report cites the findings from an international research study funded in part from the ESA CCI which confirms that the Greenland and Antarctic Ice Sheets have lost mass since the 1990s owing to surface melting and run-off. The rate of ice sheet loss is accelerating – with a four-fold increase in ice sheet loss between 1992-1999 and 2010-2019. This finding supports a key part of the report’s commentary relating to the shrinkage of the cryosphere and contribution to rising global average sea level.
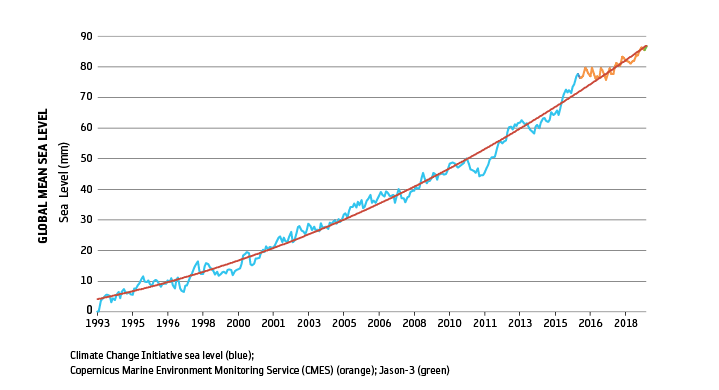
Sea level rise
Since 1901, sea level has risen by 20 cm, with the rate of increase accelerating to a high of 3.7 mm per year since 2006. Depending on future carbon emissions, mean sea level could rise a further 28-101 cm by 2100, and possibly by up to 2 m if the ice sheets become more unstable.
Global satellite altimetry records generated by the CCI, and covering the past three decades, provide the underpinning evidence for the reports claims, and are consistent with the contribution of sea level rise from ice losses – in addition to the role of thermal expansion.
Climate Change Initiative data also supported several headline statements in the IPCC sixth assessment's Working Group II report which focusses on the disruption caused by human-induced climate change across nature and impacts to billions of lives around the world.
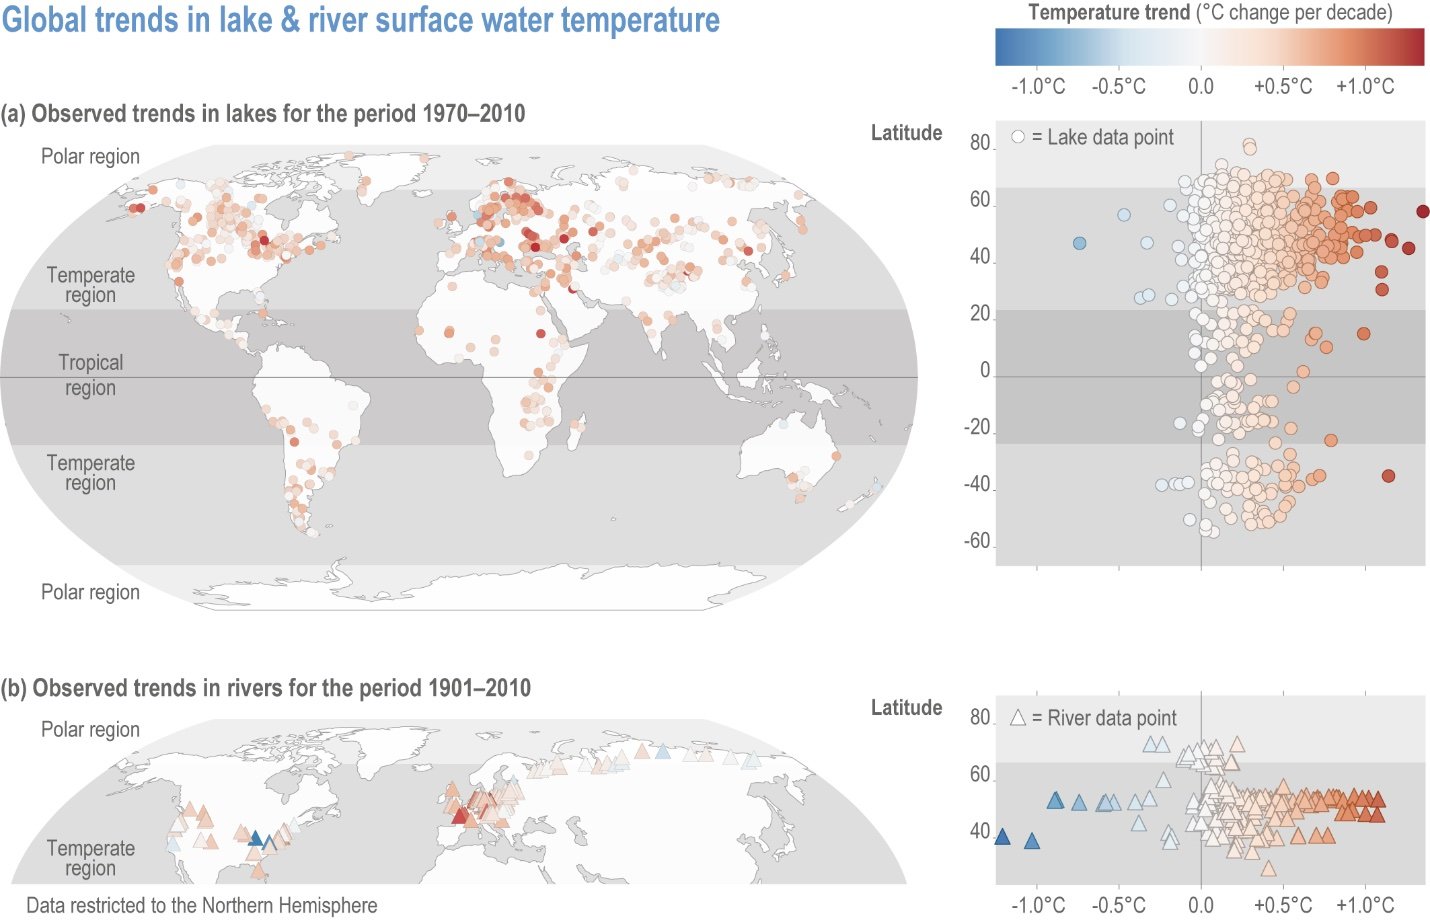
Warming Lakes
Datasets addressing the lakes ECV are relatively new, however, they were used as evidence by the IPCC to illustrate the impact of climate change across the world’s freshwater lakes. Lakes are often referred to as the sentinels of change as they integrated changes from their surrounding catchment and region.
Using the CCI satellites data the IPCC reported rising lake surface temperatures globally and pointed to lake:climate models point to increasingly severe lake heatwaves as global temperature rises. The knock-on effects on freshwater ecosystems, including biodiversity and water quality are highlighted, with the changes likely to impact surrounding communities.
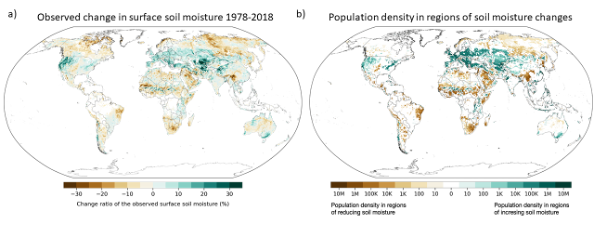
Soil moisture, land cover and ocean colour
Changing patterns of evapotranspiration and precipitation and increasing temperatures, have resulted in changing patterns of soil moisture and land surface aridity worldwide, with impacts on water availability, ecosystems and agriculture. The CCI soil moisture project for example shows increases and decreases in annual surface soil moisture of up to 20% or more between the late 1970s and mid-2010s.
Land cover data from the CCI was used by the IPCC to map the current status of tropical forests and support projections of regional biodiversity change at increasing levels of climate change.
In the ocean environment meanwhile, satellite datasets of ocean colour, which monitor change of chlorophyll-a across the ocean surface, and were used to assess changing primary production of ocean phytoplankton, which play an important role at the base of the marine food web and show phenology changes by 2100 under the net zero (SSP1-2.6) and and most sever (SSP5-8.5) baseline emissions scenarios.