
Last year was yet again unprecedented in terms of extreme weather events and climate disasters according to the World Meteorological Organization’s recently released State of the Global Climate 2020 report.
The report, which uses seven Climate Indicators to describe the changing climate, makes use of ESA satellite observations and research and development to generate long-term climate records supported by ESA’s Climate Change Initiative.
According to the report, the past six years have been the hottest on record. The average global temperature for 2020 is 1.2ºC hotter than pre-industrial times. Antonio Guterres, United Nations Secretary-General, launched the report warning: ‘we are getting dangerously close to the 1.5ºC limit set by the scientific community.’
He added that ‘increasing levels of greenhouse gases in the atmosphere due to human activities are a major driver of climate change’. Despite the lockdown of the global economy due to Covid-19, the report highlights that atmospheric concentration of carbon dioxide in 2020 topped out at a record 410±0.2 ppm, 148% above pre-industrial levels.
Shrinking ice
Satellite data have enabled scientists to chart drastic changes that are taking place across the globe over recent decades, including the Arctic region.
Arctic sea-ice, which serves as a useful indicator of climate change, fell to 3.74 million km2 in September 2020, reflecting a long-term downward trend observed from space since the late 1970s. This marks only the second time on record that the Arctic sea-ice extent has fallen below 4 million km2. Only 2012 had a lower minimum extent at 3.39 million km2.
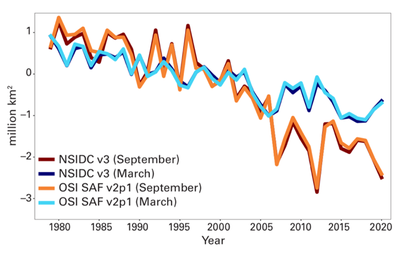
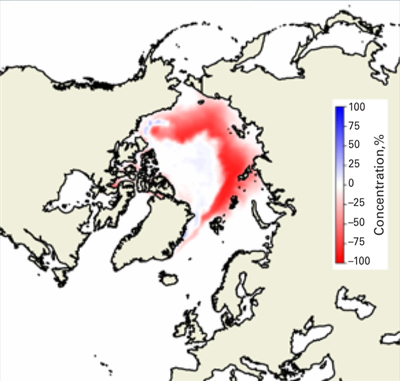
Vast areas of open ocean were observed in the Chukchi, East Siberian, Laptev, and Beaufort Seas using satellites. Sea-ice retreat in the Laptev Sea was the earliest in the entire 42-year satellite record.
Ice sheet losses
According to the report, the Greenland ice sheet ended the September 2019 to August 2020 season with an overall loss of 152 Gt of ice. Although corresponding data for Antarctica is not yet available, both ice sheets have exhibited strong mass loss since the late 1990s. Using information from ESA’s ERS, Envisat and CryoSat satellites as well as the Copernicus Sentinel-1 and Sentinel-2 missions, it is possible to identify an accelerating rate of loss from around 2005. Currently, Antarctica loses approximately 175 to 225 Gt per year. Recently, an international ESA-NASA funded research project, the Ice Sheet Mass Balance Inter-comparison Exercise (IMBIE), produced a complete picture of Greenland and Antarctica ice loss to date.
Glacier mass decline
Preliminary results provided by the World Glacier Monitoring Service (WGMS) indicate that glaciers continued to lose mass in the hydrological year 2019/20. The report highlights that eight out of ten of the most negative mass balance years have been recorded since 2010. This correlates with large scale remote sensing studies that show a long term decline global glacier mass loss. For example, Zemp et al (2019) estimated ice losses from glaciers around the world were well over nine trillion tonnes between 1961 and 2016, raising sea level by 27 mm.
ESA’s Climate Change Initiative Glaciers project team supports the WGMS by providing glacier outlines and information on ice mass changes for thousands of individual glaciers.
Rising sea level
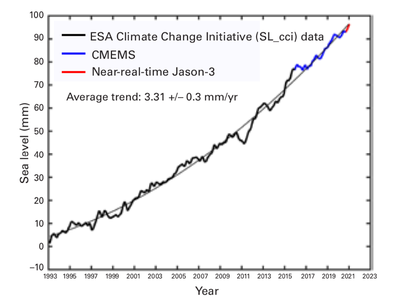
Globally, mean sea level has been rising an average of 3.3+/-0.3 mm per year since 1993, peaking in 2020 as illustrated by the long-term satellite altimetry record, developed through the ESA CCI Sea Level project. Shrinking ice sheets, ice loss from glaciers worldwide, and warming - and therefore expanding - water in the oceans, have contributed to an acceleration in sea level rise.
At the regional scale, sea level continues to rise non-uniformly. The strongest regional trends over the period January 1993 to June 2020 were seen in the southern hemisphere: east of Madagascar in the Indian Ocean; east of New Zealand in the Pacific Ocean; and east of Rio de la Plata/South America in the South Atlantic Ocean. An elongated eastward pattern was also seen in the North Pacific Ocean.
According to Susanne Mecklenberg, Head of ESA’s Climate Office, 'The report summarises the clear changes and impacts taking place due to human activities. As well as reiterating the need for a common direction of travel towards net zero emissions to achieve the objectives laid out in the Paris Agreement, this report also highlights the importance of long-term, systematic climate monitoring, particularly from space.
'These data provide evidence to inform climate action and track progress to avert the negative consequences of future climate change.'
The ESA Climate Change Initiative involves a community of over 450 Europe’s leading Earth observation to generate a suite of global, long-term and accurate satellite-derived datasets for GCOS Essential Climate Variables to support the UNFCCC process.